Brief 73: Adoption of Community Monitoring Improves Common Pool Resource Management Across Contexts
EGAP Researchers: Tara Slough, Daniel Rubenson, Darin Christensen, Alexandra Hartman, Cyrus Samii, and Johannes Urpelainen
Other researchers: Ro’ee Levy, Francisco Alpizar Rodriguez, Maria Bernedo del Carpio, Mark Buntaine, Alicia Cooperman, Sabrina Eisenbarth, Paul J. Ferraro, Louis Graham, Jacob Kopas, Alexandra (Sasha) McLarty, Anouk S. Rigterink, Brigitte Seim, and Bing Zhang
Key takeaways: Research across six countries found that community monitoring significantly reduced the use of common pool resources while increasing users’ knowledge of resource management and improving their satisfaction with these resources.
Geographical Regions: Africa, Asia, and Latin American and the Caribbean
Type of study: Comparable experimental studies in six countries
Preparer: Bhumi Purohit
Executive Summary
The maintenance of Common Pool Resources (CPRs) such as fisheries, groundwater, or forests is not only important for preserving biodiversity and slowing climate change, but also integral to improving human livelihoods and health. However, CPRs are prone to depletion because individuals have an incentive to extract resources and it is costly to limit over-extraction.
One widely-cited institution thought to improve CPR management is community monitoring, wherein community-based monitors observe, record, and disseminate resource use and depletion to their communities. However, existing studies of monitoring focus on communities that have selected into monitoring programs themselves. These communities may therefore represent a minority of groups facing CPR governance challenges. This bears an open question: does the imposition of community monitoring of CPRs from outside NGOs or governments improve management of these resources?
To answer this question, researchers examined the effectiveness of community monitoring for water and forests in 747 communities across 6 countries. This research was part of EGAP’s Metaketa Initiative (Round III), which funds and coordinates multiple studies across countries at the same time to understand how interventions work in different contexts.
Community monitoring significantly reduced the use of CPRs, which is important as these natural resources are often limited and must be preserved. Moreover, community monitoring improved users’ satisfaction with CPRs and simultaneously increased their knowledge of resource management. The findings synthesizing experimental evidence from three different resource systems across six countries suggests that community monitoring of CPRs has modest positive effects, even when facilitated externally by NGOs or governments. The results suggest that adoption of monitoring institutions—even when facilitated from outside communities—can promote to sustainable resource management.
Policy Challenge
Common Pool Resources (CPR) are large public goods and resources such as waters, fisheries, or forests. Given their size, it is difficult to effectively exclude potential beneficiaries from overusing or degrading the resource. When individual users maximize their own use of the resources, the benefits to others are reduced.1 This “tragedy of the commons” 2 has led to drastic reduction in the world’s forests, fisheries, and water, potentially contributing to climate change and threatening biodiversity. Within communities, unsustainable management of resources may harm livelihoods or threaten users’ health.
Researchers have long observed that the sustainable management of CPR requires that individuals set up rules and institutions to govern the use of resources. One important institution is monitoring, in which individuals from the community regularly observe, record, and disseminate information about the use of CPR. 1 Prior studies have examined community monitoring in communities that opt to use the system themselves. This poses a challenge in understanding the effectiveness of community monitoring in communities who have not endogenously adopted monitoring since communities that choose to monitor may differ from communities who do.
In order to overcome this challenge, this study collaborated with NGOs and governments to introduce monitoring in communities facing CPR threats. This allowed the researchers to ask: (1) Can monitoring be effectively encouraged and facilitated from outside communities? and (2) Is monitoring effective in governing resource use and depletion?
Context
In order to understand if monitoring works in a variety of contexts, this study sets up similar studies in six countries across four continents: Brazil, Costa Rica, China, Liberia, Peru, and Uganda. As seen in Table 1, researchers study the monitoring of three resource systems: groundwater (two sites), surface water (one site), and forests (three sites). All communities in these sites face a problem of managing CPR in the face of depletion or degradation. In the cases of rural Brazil and Costa Rica, drought and overextraction of water threaten long-term availability of groundwater to residents. In urban China, surface water is threatened by individual and industrial pollution. In the villages of Liberia and Uganda, deforestation led by community members is a major threat. Lastly, indigenous communities in Peru face deforestation due to extraction by those outside the community.
| Brazil | China | Costa Rica | Liberia | Peru | Uganda | |
|---|---|---|---|---|---|---|
| Contextual features of CPR | ||||||
| Resource | Groundwater | Surface water | Groundwater | Forest | Forest | Forest |
| Community | Rural villages | Urban microneighborhoods | Rural villages | Villages | Indigenous communities | Villages |
| Primary threat to resource | Drought, overuse | Individual, industrial pollution | Drought, overuse | Overcutting by residents | Extraction by outsiders | Overcutting by residents |
| Components of harmonized interventions | ||||||
| Community workshops | ✓ | — | ✓ | ✓ | ✓ | ✓ |
| Monitor selection, training, incentives | ✓ | ✓ | ✓ | ✓ | ✓ | ✓ |
| Monitoring of the resource | ✓ | ✓ | ✓ | ✓ | ✓ | ✓ |
| Dissemination to citizens | ✓ | ✓ | ✓ | ✓ | ✓ | ✓ |
| Dissemination to management bodies | — | (Alternate arm) | ✓ | ✓* | ✓* | ✓* |
| Experimental design | ||||||
| Alternate treatment arm | Conservation plan making | Dissemination to government | — | Negotiation training | — | SMS reminders |
| Experimental design | Three-arm† | 2×2 factorial | Two-arm | 2×2 factorial | Two-arm | Three-arm† |
| No. of monitoring communities (NM) | 80 | 80 | 81 | 60 | 39 | 60 |
| No. of nonmonitoring communities (N¬M) | 40 | 80 | 80 | 60 | 37 | 50 |
| Common outcome measurement | ||||||
| Duration of implementation, mo | 12 | 15 | 12 | 12 | 13 | 12 |
| Primary compliance measure | SMS reports received | Dissemination posters | Reports submitted | Monitoring walks completed | Reports submitted | Reports submitted |
| Primary resource outcome | Well electricity usage | Pollutant concentration in water | Well electricity usage, water quality | Deforestation | Deforestation | Deforestation, forest quality |
| Endline citizen survey | ✓ | ✓ | ✓ | ✓ | ✓ | ✓ |
* In the forest studies, the community constitutes at least one of the possibly overlapping management bodies.
† In both three-arm designs, communities assigned to the alternative treatment arm received both monitoring and the alternative treatment.
Research Design
In order to understand the effectiveness of monitoring efforts for CPR in diverse contexts, the researchers set up similar and comparable experimental studies in six countries: Brazil, Costa Rica, China, Liberia, Peru, and Uganda. In all sites except China, the monitoring interventions had a few common components:
- Introduction: The monitoring program was introduced through community workshop(s) led by implementing partner organizations, usually NGOs, and community members
- Selection: Individual monitors were then selected and trained to monitor CPR
- Technology: Each program used some form of technology to aid in monitoring or dissemination of findings (e.g. water-level sensors in Brazil)
- Incentives: Monitors were given locally-appropriate monetary incentives to provide either monthly or quarterly reports for at least one year
- Dissemination: Data from monitors was disseminated to citizens through fliers and/or community meetings, and to at least one management body overseeing the CPR.
While the monitoring intervention was harmonized to the extent possible, the existing institutions governing CPR use varied across sites. To examine the effects of community monitoring, the researchers compare the status of CPR in communities randomly assigned to community monitoring to those that were not. They measure the status of CPR through physical or chemical measurements of the resource. They also conducted endline surveys of citizens in all communities with and without monitoring.
Results
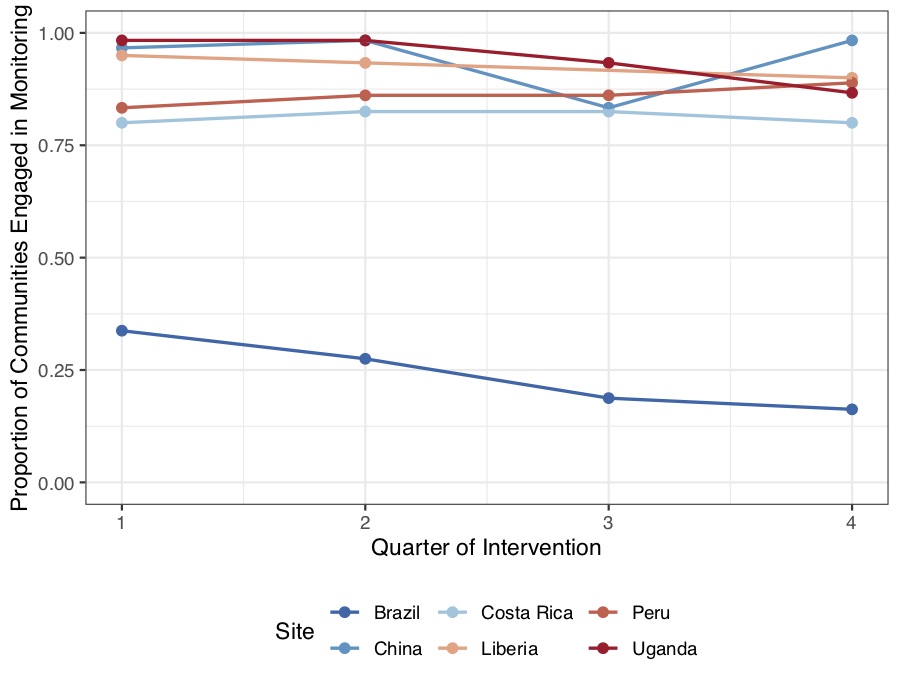
The researchers first study the uptake of monitoring in treatment communities to ask whether monitoring practices can be facilitated from the outside. Five of the six sites report high rates of uptake and sustained monitoring over the course of a year-long intervention. In these sites, at least 80% of communities monitored resources in every quarter of the year, as seen in Figure 1. In contrast, in Brazil, uptake was much lower and monitoring rates dropped over the course of the year. There are several possible reasons for this disparity. In Brazil, implementing partners had a weaker on-the-ground presence over the course of the year and the technological instruments designed to aid monitoring were not usable in all communities.
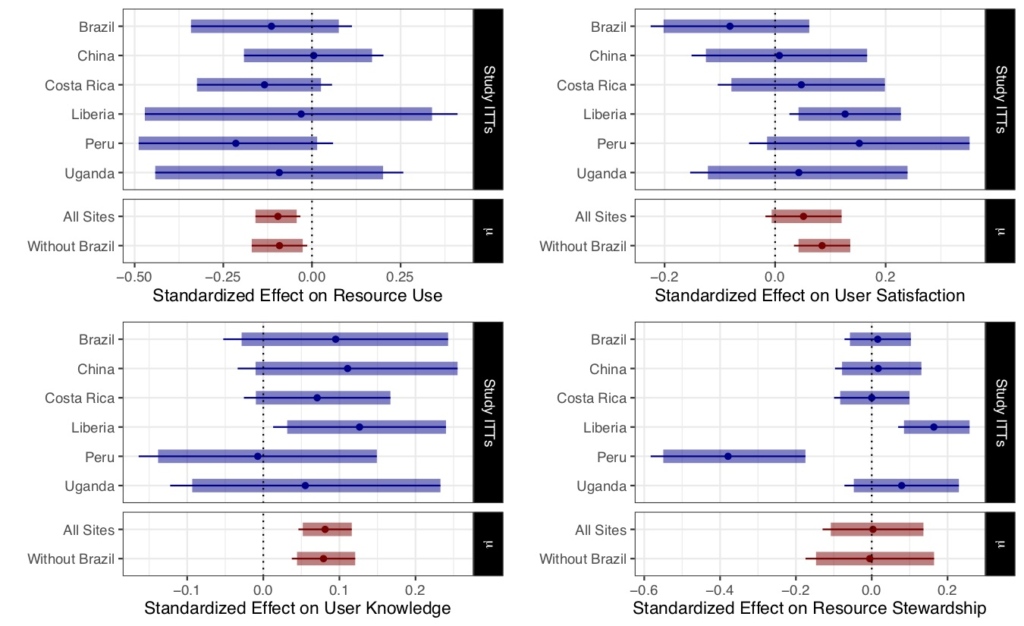
The researchers study four primary outcomes: uptake of monitoring, resource use, satisfaction with CPR, knowledge of CPR, attitudes towards conservation of CPR, perceptions of sanctioning for misuse, and stewardship. The researchers measure stewardship by inquiring about individual community members’ norms against behaviors that degrade CPRs and their willingness to participate in or contribute to CPR protection efforts. Overall, the results indicate that community monitoring leads to a reduction in resource extraction, an improvement in user satisfaction with CPR, an increase in user knowledge about CPR, and no change in stewardship. Country-level results are available in Figure 2.
- Resource Use: Community monitoring reduced the extraction of community pooled resources. Extraction is measured by forest loss in Liberia, Peru and Uganda; water pollution in China and Costa Rica; and water use in Brazil and Costa Rica. Importantly, monitoring interventions yield the highest effects where resource extraction problems were the most acute.
- Satisfaction: Though community members reduced their short-term use of resources, they reported high levels of satisfaction with the uptake of community monitoring.
- Knowledge: Monitoring increased knowledge, including in areas such as issues related to CPR, the level of CPR in communities, and causes of resource degradation. Monitoring also increased knowledge of CPR management authorities
- Stewardship:Monitoring did not have a consistent effect on resource stewardship. Monitoring increased stewardship in Liberia while decreasing it in Peru. The authors attribute these divergent outcomes to different existing institutions for CPR management.
Lessons
The study shows that with adequate training and resources, community monitoring can be exogenously created to reduce resource extraction in a variety of settings. Furthermore, the high level of uptake and satisfaction suggests that interventions may be sustainable over an extended period of time. Given the study was only conducted for a year, further research is needed to understand the long-term sustainability of monitoring efforts. Additionally, the effects of monitoring are modest and additional interventions may be needed to yield larger conservation gains. Future research can take a similar multi-site approach to understand if other institutions to address CPR problems are effective.
References
1Ostrom, Elinor. 1990. Governing the Commons: The Evolution of Institutions for Collective Action. Cambridge: Cambridge University Press.
2Hardin, Garrett. 1968. “The Tragedy of the Commons.” Science, 162(3859): 1243–1248.