Script: Power Analysis Simulations in R
This page gives code in R for some basic and some more complicated power analyses. Please check out EGAP’s 10 Things You Need To Know About Statistical Power for some intuition and guidance when using this code.
Power analysis for the standard design
The standard design randomly assigns subjects to either treatment or control with probability 0.5. We have to make assumptions about the size of the treatment effect and the standard deviation of the outcome variable. We then vary the total number of subjects to see how power will vary with sample size.
This operation can be done with an analytically derived formula, but this simulation will provide the basis for more complicated designs.
possible.ns <- seq(from=100, to=2000, by=50)     # The sample sizes we'll be considering
powers <- rep(NA, length(possible.ns))           # Empty object to collect simulation estimates
alpha <- 0.05                                    # Standard significance level
sims <- 500                                      # Number of simulations to conduct for each N

#### Outer loop to vary the number of subjects ####
for (j in 1:length(possible.ns)){
  N <- possible.ns[j]                              # Pick the jth value for N

  significant.experiments <- rep(NA, sims)         # Empty object to count significant experiments

  #### Inner loop to conduct experiments "sims" times over for each N ####
  for (i in 1:sims){
    Y0 <-  rnorm(n=N, mean=60, sd=20)              # control potential outcome
    tau <- 5                                       # Hypothesize treatment effect
    Y1 <- Y0 + tau                                 # treatment potential outcome
    Z.sim <- rbinom(n=N, size=1, prob=.5)          # Do a random assignment
    Y.sim <- Y1*Z.sim + Y0*(1-Z.sim)               # Reveal outcomes according to assignment
    fit.sim <- lm(Y.sim ~ Z.sim)                   # Do analysis (Simple regression)
    p.value <- summary(fit.sim)$coefficients[2,4]  # Extract p-values
    significant.experiments[i] <- (p.value <= alpha) # Determine significance according to p <= 0.05
  }

  powers[j] <- mean(significant.experiments)       # store average success rate (power) for each N
}
plot(possible.ns, powers, ylim=c(0,1))
Power analysis for covariate control
Including covariates as regressors can help the precision with which treatment effects are estimated. We’re not including the covariates because we are interested in the causal impact of the covariates on outcomes, but because we are interested in reducing the noise environment of our experiment. By modeling the dependent variable as a function of some covariates plus error, we are effectively reducing the standard deviation of our outcomes.
Suppose that due to some prior observational research, we know that income is correlated with both gender and age — men earn more than women, and older people earn more than young people. We can include estimates of the strength of this correlation when we generate hypothetical potential outcomes. (line 16 of the code block below).
When we control for covariates, the predictive ability of our model increases. This has strong implications for power. The graph below shows the output of this simulation — at any sample size, the covariate-adjusted model does better than the unadjusted model. In fact, the unadjusted model requires three times as many subjects to achieve 80% power than does the covariate-adjusted model.
rm(list=ls())
possible.ns <- seq(from=100, to=2000, by=50)
powers <- rep(NA, length(possible.ns))
powers.cov <- rep(NA, length(possible.ns))        # Need a second empty vector
alpha <- 0.05
sims <- 500
for (j in 1:length(possible.ns)){
  N <- possible.ns[j]

  significant.experiments <- rep(NA, sims)
  significant.experiments.cov <- rep(NA, sims)      # Need a second empty vector here too

  for (i in 1:sims){
    gender <- c(rep("F", N/2), rep("M", N/2))       # Generate "gender" covariate
    age <- sample(x=18:65, size=N, replace=TRUE)    # Generate "age" covariate
    effectofgender <- 10                            # Hypothesize the "effect" of gender on income
    effectofage <- 2                                # Hypothesize the "effect" of age on income

    ## Hypothesize Control Outcome as a function of gender, age, and error
    Y0 <- effectofgender*(gender=="M") + effectofage*age + rnorm(n=N, mean=100, sd=20)

    ## This is all the same ##
    tau <- 5
    Y1 <- Y0 + tau
    Z.sim <- rbinom(n=N, size=1, prob=.5)
    Y.sim <- Y1*Z.sim + Y0*(1-Z.sim)
    fit.sim <- lm(Y.sim ~ Z.sim)

    ## This is the novel analysis -- including two covariates to increase precision ##
    fit.sim.cov <- lm(Y.sim ~ Z.sim + (gender=="M") + age)

    ## extract p-values and calculate significance ##
    p.value <- summary(fit.sim)$coefficients[2,4]
    p.value.cov <- summary(fit.sim.cov)$coefficients[2,4]
    significant.experiments[i] <- (p.value <= alpha)
    significant.experiments.cov[i] <- (p.value.cov <= alpha)
  }

  powers[j] <- mean(significant.experiments)
  powers.cov[j] <- mean(significant.experiments.cov)
}

plot(possible.ns, powers, ylim=c(0,1))
points(possible.ns, powers.cov, col="red")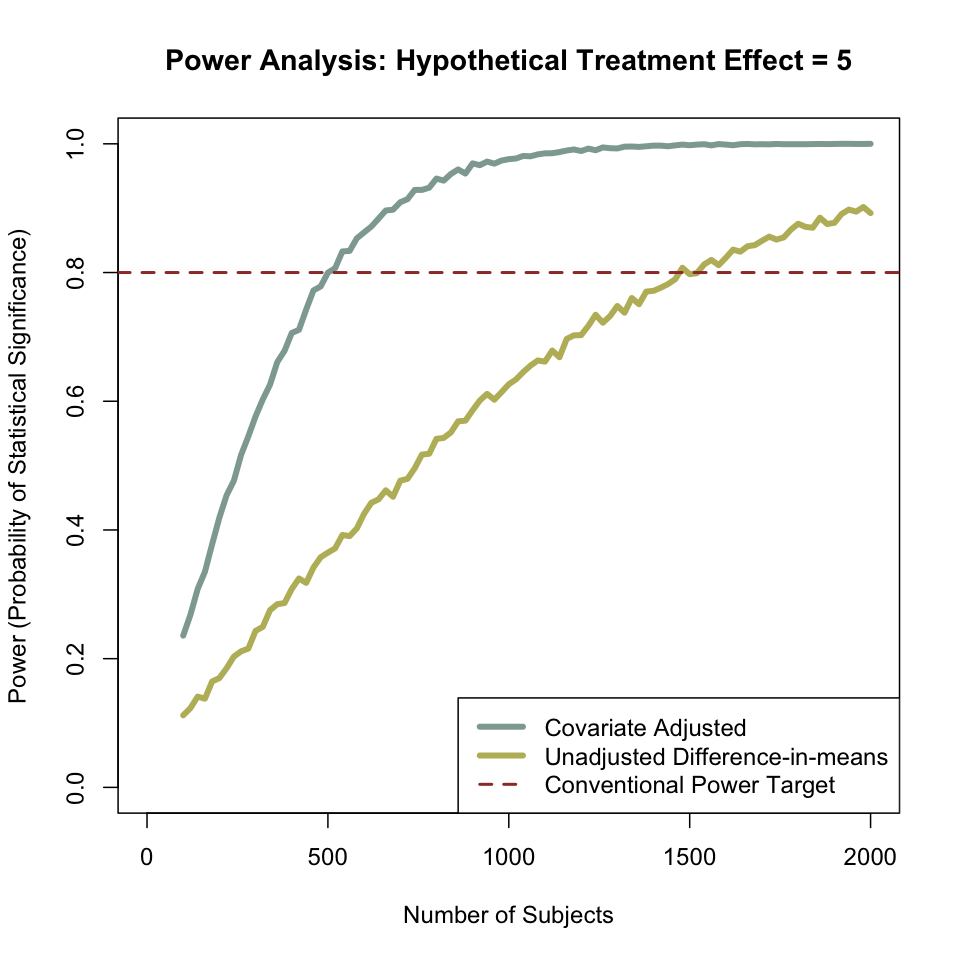
Power analysis for multiple treatments
When you conduct an experiment with multiple treatment arms, you are increasing the number of opportunities to turn up a significant result – though the significance statistics may be misleading. At the limit, consider an experiment with 20 treatment arms — even if all the treatments are ineffective, we would expect about one of the treatments to turn up significant at the 0.05 level, just by chance. A common approach is to employ a Bonferroni correction, where the significance level is divided by the number of total comparisons made with the same data.
If you plan to test multiple treatments with the Bonferroni correction, power analysis becomes more complicated. What is the “power” of an experiment that has multiple arms? It could be one of at least three things, from least demanding to most demanding:
- The probability that at least one of the treatments turns up significant.
- The probability that all of the treatments turn up significant.
- The probability that the treatment effects will be in the hypothesized ranking, and that all the differences are significant.
The simulation we’re conducting here supposes that the first treatment has an ATE of 2.5 and the second treatment has an ate of 5.0. For each subject pool size, what’s the probability of our suite of hypotheses holding up?
rm(list=ls())
#install.packages("randomizr")
library(randomizr)    # randomizr package for complete random assignment

possible.ns <- seq(from=100, to=5000, by=100)
power.atleastone <- rep(NA, length(possible.ns))
power.bothtreatments <- rep(NA, length(possible.ns))
power.fullranking <- rep(NA, length(possible.ns))
alpha <- 0.1  #(one-tailed test at .05 level)
sims <- 100
#### Outer loop to vary the number of subjects ####
for (j in 1:length(possible.ns)){
  N <- possible.ns[j]
  p.T1vsC <- rep(NA, sims)
  p.T2vsC <- rep(NA, sims)
  p.T2vsT1 <- rep(NA, sims)
  c.T1vsC <- rep(NA, sims)
  c.T2vsC <- rep(NA, sims)
  c.T2vsT1 <- rep(NA, sims)
  #### Inner loop to conduct experiments "sims" times over for each N ####
  for (i in 1:sims){
    Y0 <-  rnorm(n=N, mean=60, sd=20)
    tau_1 <- 2.5
    tau_2 <- 5
    Y1 <- Y0 + tau_1
    Y2 <- Y0 + tau_2
    Z.sim <- complete_ra(N=N, num_arms=3)
    Y.sim <- Y0*(Z.sim=="T3") + Y1*(Z.sim=="T1") + Y2*(Z.sim=="T2")
    frame.sim <- data.frame(Y.sim, Z.sim)
    fit.T1vsC.sim <- lm(Y.sim ~ Z.sim=="T1", data=subset(frame.sim, Z.sim!="T2"))
    fit.T2vsC.sim <- lm(Y.sim ~ Z.sim=="T2", data=subset(frame.sim, Z.sim!="T1"))
    fit.T2vsT1.sim <- lm(Y.sim ~ Z.sim=="T2", data=subset(frame.sim, Z.sim!="T3"))

    ### Need to capture coefficients and pvalues (one-tailed tests, so signs are important)
    c.T1vsC[i] <- summary(fit.T1vsC.sim)$coefficients[2,1]
    c.T2vsC[i] <- summary(fit.T2vsC.sim)$coefficients[2,1]
    c.T2vsT1[i] <- summary(fit.T2vsT1.sim)$coefficients[2,1]
    p.T1vsC[i] <- summary(fit.T1vsC.sim)$coefficients[2,4]
    p.T2vsC[i] <- summary(fit.T2vsC.sim)$coefficients[2,4]
    p.T2vsT1[i] <- summary(fit.T2vsT1.sim)$coefficients[2,4]
  }
  power.atleastone[j] <- mean(c.T1vsC>0 & c.T2vsC>0 & (p.T1vsC < alpha/2 | p.T2vsC < alpha/2))
  power.bothtreatments[j] <- mean(c.T1vsC>0 & c.T2vsC>0 & p.T1vsC < alpha/2 & p.T2vsC < alpha/2)
  power.fullranking[j] <- mean(c.T1vsC>0 & c.T2vsC>0 & c.T2vsT1 > 0 & p.T1vsC < alpha/2 & p.T2vsT1 < alpha/2)
  print(j)
}

plot(possible.ns, power.atleastone, ylim=c(0,1))
points(possible.ns, power.bothtreatments, col="red")
points(possible.ns, power.fullranking, col="blue")
The results of this simulation are graphed below: with 800 or so subjects equally allocated between the three treatments, this experiment is about 80% likely to recover at least one significant result. Achieving two significant results is much more demanding, not least because of the Bonferroni correction: having both treatments turn up significant 80% of the time would require 3000 subjects. Finally, demonstrating the hypothesized differences in terms of a complete ranking would require about 4000 subjects — a corollary to this is that testing fully specified theories is particularly resource-intensive!
